Fixed Income Quarterly - Q1 2026
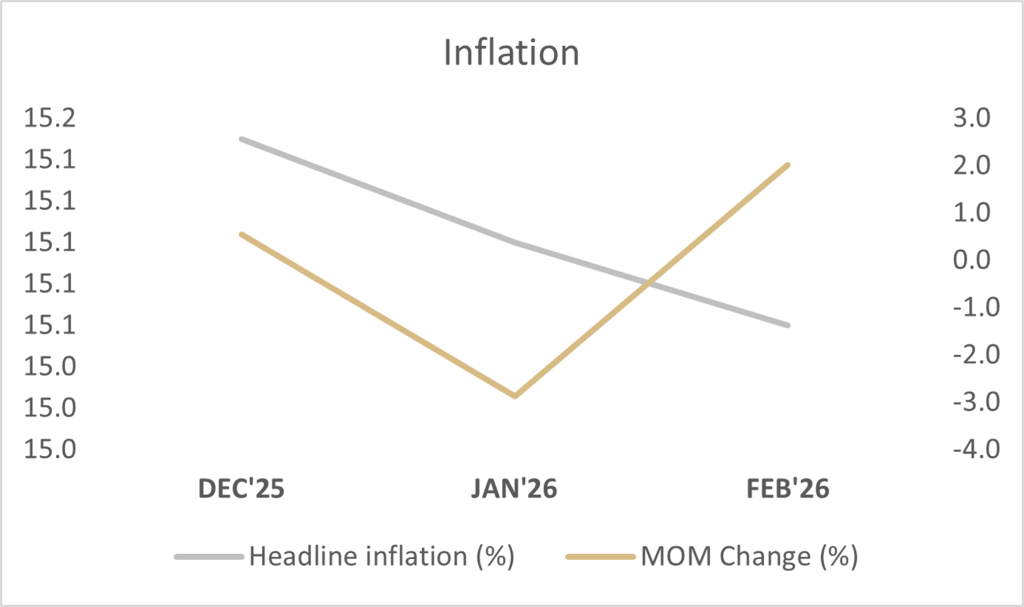
Consumer price index eased marginally in February 2026, with headline inflation at 15.06% year-on-year from 15.10% in January. However, on a month-on-month basis, it printed at 2.01% in February 2026, as against -2.88% in the previous month, which can be attributed to rising cost of energy.
At the Monetary Policy Committee (MPC) February meeting, the Monetary Policy Rate (MPR) was reduced by 50 basis points to 26.50%. The asymmetric corridor was retained at +50/-450 basis points around the MPR, and the Cash Reserve Ratio (CRR) for Deposit Money Banks, Merchant Banks and non-TSA public sector deposits was retained at 45%, 16% and 75% respectively.
Crude oil prices averaged $78.28 per barrel in Q1 2026, swinging between a low of $59.96 and a high of $112.78. Early quarter oversupply and elevated global inventories kept Brent near the $60 range. However, escalating geopolitical tensions in Iran, particularly disruptions affecting the Strait of Hormuz, triggered a sharp supply shock that pushed prices above $110.
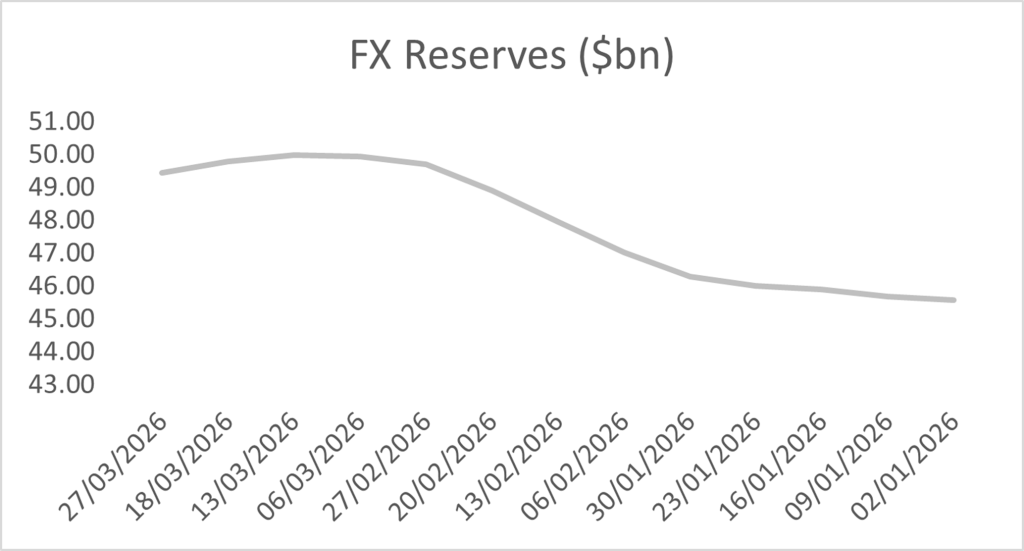
Nigeria’s Composite PMI stood at 56.8pts in February 2026, as business activities expanded strongly across industry, services, and agriculture. As of March 27, 2026, external reserve was $49.44 billion, representing a 9.26% increase from the average of $45.25 billion recorded in December 2025. Total FAAC disbursement for the quarter amounted to approximately ₦5.757 trillion, with January accounting for the highest monthly allocation at around ₦1.969 trillion. Interbank liquidity averaged approximately ₦3.91 trillion in credit during the quarter, peaking at around ₦8.87 trillion in late March and dipping to a repo of roughly ₦973.89 billion in late January.
Bond market
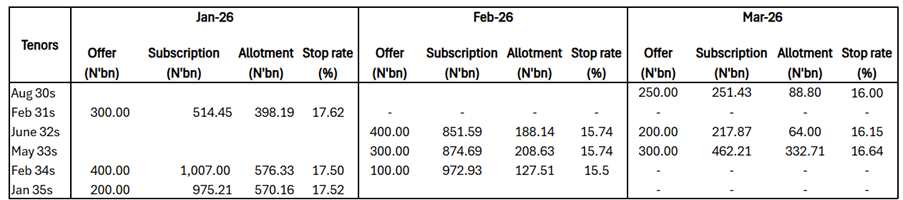
The bond market in Q1 2026 reflected an evolving interplay between liquidity conditions, policy direction, and investor positioning. January opened on a mixed note, with early demand supported by softer-than-expected inflation data, which drove selective buying across short- to mid-term maturities. However, sentiment turned cautious mid-month as the market adjusted to incoming supply, leading to some upward pressure on yields, particularly at the belly of the curve. Activity remained mild toward the month-end, with demand re-emerging in select tenors. At the primary market auction, the Debt Management Office (“ DMO”) offered ₦900bn but allotted ₦1.5tn across the 2031s, 2034s, and 2035s, clearing at 17.62%, 17.50%, and 17.52%, respectively, reflecting solid demand at relatively elevated yield levels.
In February, market direction became clearer following the Monetary Policy Committee’s decision to cut rates by 50bps, which drove a repricing across the curve. Demand strengthened, particularly at the belly, leading to a notable decline in yields. Average bond yields fell as activity improved in both the primary and secondary markets. At the monthly auction, the DMO offered ₦800bn and allotted ₦525bn across the 2032s, 2033s, and 2034s, with stop rates moderating to 15.74% and 15.50%, in line with the broader downward shift in yields.
March saw the market adopt a more cautious tone amid heightened global volatility as activity moderated, with focus remaining on prevailing yield levels and auction dynamics. At the primary market auction, the DMO offered ₦750bn and allotted ₦485.51bn across the 2030s, 2032s, and 2033s, with marginal rates of 16.00%, 16.15%, and 16.64%, respectively.
Overall, Q1 2026 was characterised by an initial period of adjustment followed by a gradual moderation in yields as the market responded to easing policy conditions and sustained demand at key tenors. However, the re-emergence of geopolitical risks toward the end of the quarter underscores a more complex backdrop for the market.
Treasury bill market
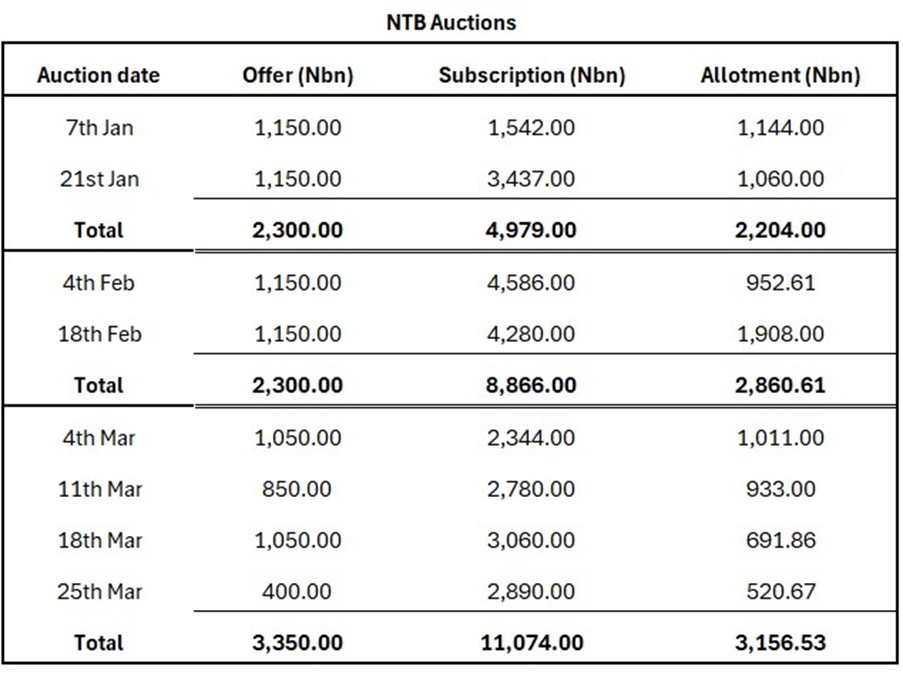
In Q1 2026 the Nigerian Treasury Bills market was characterized by a bullish bias, supported by strong system liquidity and sustained appetite for the primary market. This was evident by the persistent oversubscription at the Primary Market Auctions (PMAs) throughout the quarter, particularly on the long-dated papers. After the Monetary Policy Committee (MPC) meeting, which resulted in the MPR being cut by 50bps to 26.50%. Demand was skewed heavily towards the long-dated maturities, as investors sought to lock in attractive yields. The 4 March auction was oversubscribed at N2.34trn against the N1.05trn on offer, while the 364-day stop rate rose to 16.73% (c.83bps above the previous auction). By the 25 March auction, demand was still robust, with N2.89trn subscription met by a total sales of N520.67bn, underscoring continued interest at the long end of the curve, despite the decline in stop rated.
Sentiments gradually shifted from predominantly bullish in the quarter to more cautious and selective towards quarter-end. Liquidity was the key swing factor; system liquidity climbed to N8.06trn in mid-March, with the CBN OMO sales reached c. N22trn in the quarter. This reflected how abundant cash conditions coexisted with active mopping up by CBN. The quarter ended with cherry-picking on the long-dated papers and the 25-Mar bill trading at a range of 16.00-16.10%.
The CBN floated fifteen (15) OMO auctions during the quarter, offering c. N9.00trn across the tenors. Total sales through the quarter were over c. N22trn. Despite the oversubscriptions recorded at the auctions, there were six (6) no sale during the auctions.
The DMO conducted eight (8) NTB auctions during the quarter with each month recording an oversubscription of N2.679trn, N6.566trn and N7.724trn respectively. In total, the FG oversold c. N306bn, by allotting N8.256trn against the N7.950trn on offer. Stop rates at the last auction of the quarter closed at 15.95%, 16.42% and 16.43% across the 91-days, 182-days and 364-days tenors respectively.
Eurobond Market
The first quarter of 2026 saw SSA sovereign eurobonds trading in a mixed environment. Global investors grappled with sharply higher oil prices and geopolitical jitters, even as U.S. rates stayed on hold. In mid-March the U.S.–Israeli conflict with Iran pushed Brent crude above $100/barrel, lifting fears of imported inflation. Yet the Fed kept policy unchanged in January and again in March, and its latest projections still expect only one quarter-point cut by year-end. In practice, markets have pushed Fed easing into 2027. China added a glimmer of support: after contracting in January–February, its manufacturing PMI rebounded above 50 in March (50.4). The net effect was a pause in global risk-taking: SSA bond curves ended the quarter slightly flatter or tighter. Investors favored holding 7–10 year maturities, while headlines—credit stories and fiscal policies—drove relative moves.
Global Economic Factors
The U.S. Federal Reserve left its policy rate at 3.50–3.75% in both January and March. The central bank now projects one small cut by end-2026—unchanged from December—but “meaningful” numbers of Fed officials shifted to delaying any cut until 2027. With Powell noting that inflation was slowing only gradually, markets fully priced out 2026 easing. U.S. Treasury yields jumped: by late March, the 10-year was near 4% after the war shock. Brent crude spiked over $100 in March, driven by Middle East tensions. Prices later eased, but Q1 saw oil ~40% higher year-to-date. The dramatic swing in oil benefits net exporters (like Angola) but strains importers (like Egypt).
Trade tensions took a back seat. The 90-day U.S.-China tariff truce (signed late 2025) lingered into Q1, meaning no major tariff escalations. Amid this calm, China’s export and industrial activity picked up by quarter-end. The official manufacturing PMI had dipped to ~49 in Jan–Feb but jumped to 50.4 in March—its first expansion reading in a year. Investors noted that China’s stimulus plans (accelerated infrastructure spending) may not fully lift global risk appetite yet.
In sum, Q1’s global backdrop was one of “benign neglect” by central banks, punctuated by war-driven volatility. Easy Fed assumptions and a stable dollar buoyed carry trades, but the oil shock and safe-haven flows kept a floor under bond yields. In SSA, these factors translated into generally tighter curves and improved issuance conditions, with the usual caveat: countries with clear policies and strong fundamentals outperformed those with visible fiscal or external gaps.
Country Event
Nigeria
Nigeria entered 2026 with inflation on a slow decline and ample reserves. Headline inflation eased very gradually marking a 10th/11th straight monthly slowdown. (These numbers reflect NBS’s new methodology using 2024 as the base.) While still high, headline inflation is far below its mid-2024 peak (~31%) and well under the central bank’s estimates.
Against that backdrop, the Central Bank of Nigeria (CBN) resumed easing. The bank explicitly cited the multi-month disinflation and stable FX conditions. Real rates remain very positive (policy >10% above inflation), so the cut was modest in context. Official commentary emphasized caution: future cuts will be data-dependent, with a focus on preserving naira stability and curbing food/energy shocks.
Nigeria’s reserves have swelled with higher oil receipts. This buffer (the strongest since at least 2020) stems from robust crude export earnings, steady portfolio inflows, and ongoing forex-market reforms.
However, Eurobond markets traded bearishly. Investors overlooked the >$100/bbl oil windfall, focusing instead on severe fiscal vulnerabilities. The newly approved 2026 budget projects a ₦31.46 trillion deficit, with debt service consuming about half of federal revenues. Heightened anxieties surrounding unbudgeted spending ahead of the 2027 elections triggered broad-based sell pressures across the sovereign curve, pushing the average benchmark yield up to 7.10% by early February before escalating further during the March geopolitical sell-off.
Kenya
Kenya’s macro picture remained benign. Inflation stayed low (around 4–5%) and well within the 2.5–7.5% target. In January, headline CPI was just 4.4%. Given the ample room, the Central Bank of Kenya (CBK) continued easing. On Feb 10 the CBK cut its Central Bank Rate by 25bp to 8.75% – the tenth straight cut. The MPC cited subdued inflation and the need to revive credit. It also narrowed the interest-rate corridor to ±50bps around the CBR, a technical tweak to enhance pass-through. Credit growth is starting to pick up from depressed levels, and growth forecasts remain solid (~5.5% in 2026).
Kenya’s fiscal story remains mixed. The government is under pressure to boost revenue (through reforms and new taxes) but is also an election year, which could drive spending. Markets thus kept a credit watch on the budget deficit. In eurobonds, Kenya’s spreads generally tightened modestly as global yields fell in January. The 2026–2032 segment has been well bid, with yields 20–30bp lower by quarter-end. However, investors remain wary: we continue to hear calls for better revenue execution to keep debt stable. If Kenya locks in its fiscal reforms (as planned) by mid-year, the curve can compress further. Otherwise, any slippage would trigger a pullback, especially in the long end.
Angola
Angola navigated Q1 2026 bolstered by strong economic momentum and a massive positive terms-of-trade shock, yet the central bank opted for extreme caution. The domestic disinflationary trend persisted, with headline CPI falling to 13.35% in February 2026, the lowest since July 2023, supported by a stable kwanza and improved goods availability. The real economy also accelerated, recording 5.7% growth in Q4 2025.Despite these metrics, the Banco Nacional de Angola (BNA) halted its easing cycle in March, holding the basic reference rate at 17.50%.
This hawkish pause was a direct response to the US-Israel-Iran conflict, with policymakers prioritizing currency defense against the threat of a renewed global inflation shock. Fiscally, the sovereign is a primary beneficiary of the >$100/bbl Brent crude price, generating a massive current account windfall.
In late March, Angola aggressively moved to reshape its debt: the government launched a $1.75 bn buyback offer for its 2028 eurobonds (tendering at $1,020 per $1,000). To help fund this buyback, Angola tapped international capital markets. It raised about $2.5 bn via dual-tranche notes (7-year and 11-year maturities). These new bonds priced with coupons in the high-9% range (roughly 9.25% and 9.8%) – far tighter than Angola’s previous issues, thanks to strong investor demand (the order book was ~2x covered). The timing capitalized on Brent trading in the $80s–$110s during March. The oil bonus (and a small current-account surplus) not only funded the buyback at a slight premium but also underpinned Angola’s foreign reserves (now about $23 bn).
Market response was very positive. Angola’s spreads were among the best performers in Q1. Yields on its outstanding bonds fell roughly 50–100bp (depending on tenor) through March, recouping much of the widening seen earlier in the month amid global risk-off. Long-dated Angola paper rallied, even as other low-rated African bonds came under pressure. Eurobond spread tightening was constrained by the looming 2027 election cycle. Investors anticipate that the incumbent administration will channel the oil windfall into pro-cyclical pre-election spending rather than aggressive liability management, limiting the potential for structural credit rating upgrades and capping upside price action.
Egypt
Egypt endured the most severe compounding of domestic and external shocks in the region during Q1 2026. The Central Bank of Egypt (CBE) initiated the quarter with a 100 bp rate cut in February, lowering the deposit rate to 19.0% and reducing the commercial bank reserve requirement to 16%. However, this easing was immediately undermined by a resurgence in price pressures. Annual urban headline inflation spiked to 13.4% in February from 11.9% in January, driven by an 18.7% surge in education fees and acute volatility in food prices.
This domestic inflation crisis was radically exacerbated by the Middle East conflict. The effective closure of the Red Sea maritime routes delivered a catastrophic $10 billion blow to Suez Canal revenues, crippling Egypt’s primary source of foreign exchange. Compounded by a doubled energy import bill due to surging oil prices, the sovereign faced immense balance-of-payments pressures. Consequently, the CBE abruptly abandoned its easing cycle, with March MPC consensus shifting to a hawkish hold. Egyptian spreads widened aggressively as investors repriced the sovereign’s heavy financing needs and acute vulnerability to prolonged global trade route disruptions.
Q2 2026 Outlook
Local market
In Q2 2026, we expect the market to remain cautiously constructive, with yields likely to trend slightly lower, supported by prior policy easing and still-ample system liquidity. However, intermittent volatility, driven by global risks, could briefly push yields higher, but overall market direction should remain anchored by domestic liquidity conditions and monetary policy expectations.
Eurobond market
The external environment suggests SSA spreads will stay stable to slightly tighter in Q2, with country dispersion remaining wide. Key themes and watchpoints include:
- Nigeria: If disinflation continues (CPI edging toward high-teen percentages) and reserves stay elevated, the CBN may cut again modestly, assuming the naira holds. However, energy-sector frictions (fuel pricing), FGN budget deficit, and 2027 pre-election spending remain the wildcards. Positioning favors short-duration carry, over curve exposure.
- Angola: The BNA’s policy pivot allows room for further easing if inflation keeps falling. Another 100bp cut in Q2 is possible. The success of the debt-refinancing plan will be watched closely. If oil stays above $80 and reserves firm, Angola could tap more markets under favorable terms. Key risks: oil price reversals, delays in the buyback issuance (scheduled for early April), and 2027 election pro-cyclical spending would test investor patience.
- Egypt: The war’s toll—a $10 billion collapse in Suez Canal receipts and inflationary pass-through from >$100 oil—has derailed the recovery narrative, pushing inflation near 14% and forcing the CBE into a post-February pause. A modest April cut is possible if disinflation resumes and reserves hold, but the outlook ultimately hinges on the upcoming IMF EFF review and fiscal consolidation progress. Maintain severe underweight until definitive geopolitical de-escalation restores maritime trade flows.
- Kenya: The CBK may deliver another small rate cut (e.g., 25 bp) if inflation remains anchored and the economy needs support. The main test is fiscal: Nairobi must deliver on its revenue-enhancement package and prudent spending to stabilize debt/GDP. Strong multilateral support (World Bank, AfDB) is in place, but execution risk is nontrivial. If Nairobi secures funding smoothly, Kenyan spreads can tighten; any shortfall will be penalized.